
5 key questions to understand how leveraging Monte Carlo simulations with Strategic Modeling will improve your organization’s forecasting accuracy and decision-making process.
Did you know?
Did you know that Oracle’s Strategic Modeling solution contains Monte Carlo simulation capabilities embedded into its calculation engine? This capability extends Strategic Modeling’s lead as the premier solution for scenario and sensitivity modeling in the Enterprise Performance Management (EPM) software space.
What are the use cases of Monte Carlo simulations that will help our organization?
There are hundreds of use cases for Monte Carlo simulations. Any time you have input assumptions that are uncertain and difficult to forecast (e.g., exchange rates, interest rates, inflation, commodity prices, etc.), it introduces risk into your forecast outputs and therefore would be a good use case for Monte Carlo simulations. Having said that, here are some key use cases:
- You can quantify the probability of achieving your earnings per share (EPS) guidance. Or better yet, you can provide EPS guidance that you are very confident you will achieve based on percentiles and confidence intervals of your simulation.
- You can quantify the probability and risk that a strategic initiative or capital project has a net present value less than zero (or any other value).
- You can measure the likelihood of reaching key financial targets.
- Banking and insurance companies can stress test economic and financial risk to satisfy regulatory requirements and to safeguard against insolvency.
What is Monte Carlo simulation?
Monte Carlo simulation is a statistical modeling technique used to measure the probability of different outcomes. It is used to assess and quantify risk and uncertainty in forecasting models. It acknowledges that forecasting is inherently uncertain and therefore runs hundreds or thousands of simulations using ranges of possible values around uncertain input variables rather than a single best guess.
How does it work?
Monte Carlo simulation works by applying distribution curves to uncertain forecast assumptions. Strategic Modeling provides a gallery of distribution curves to choose from:
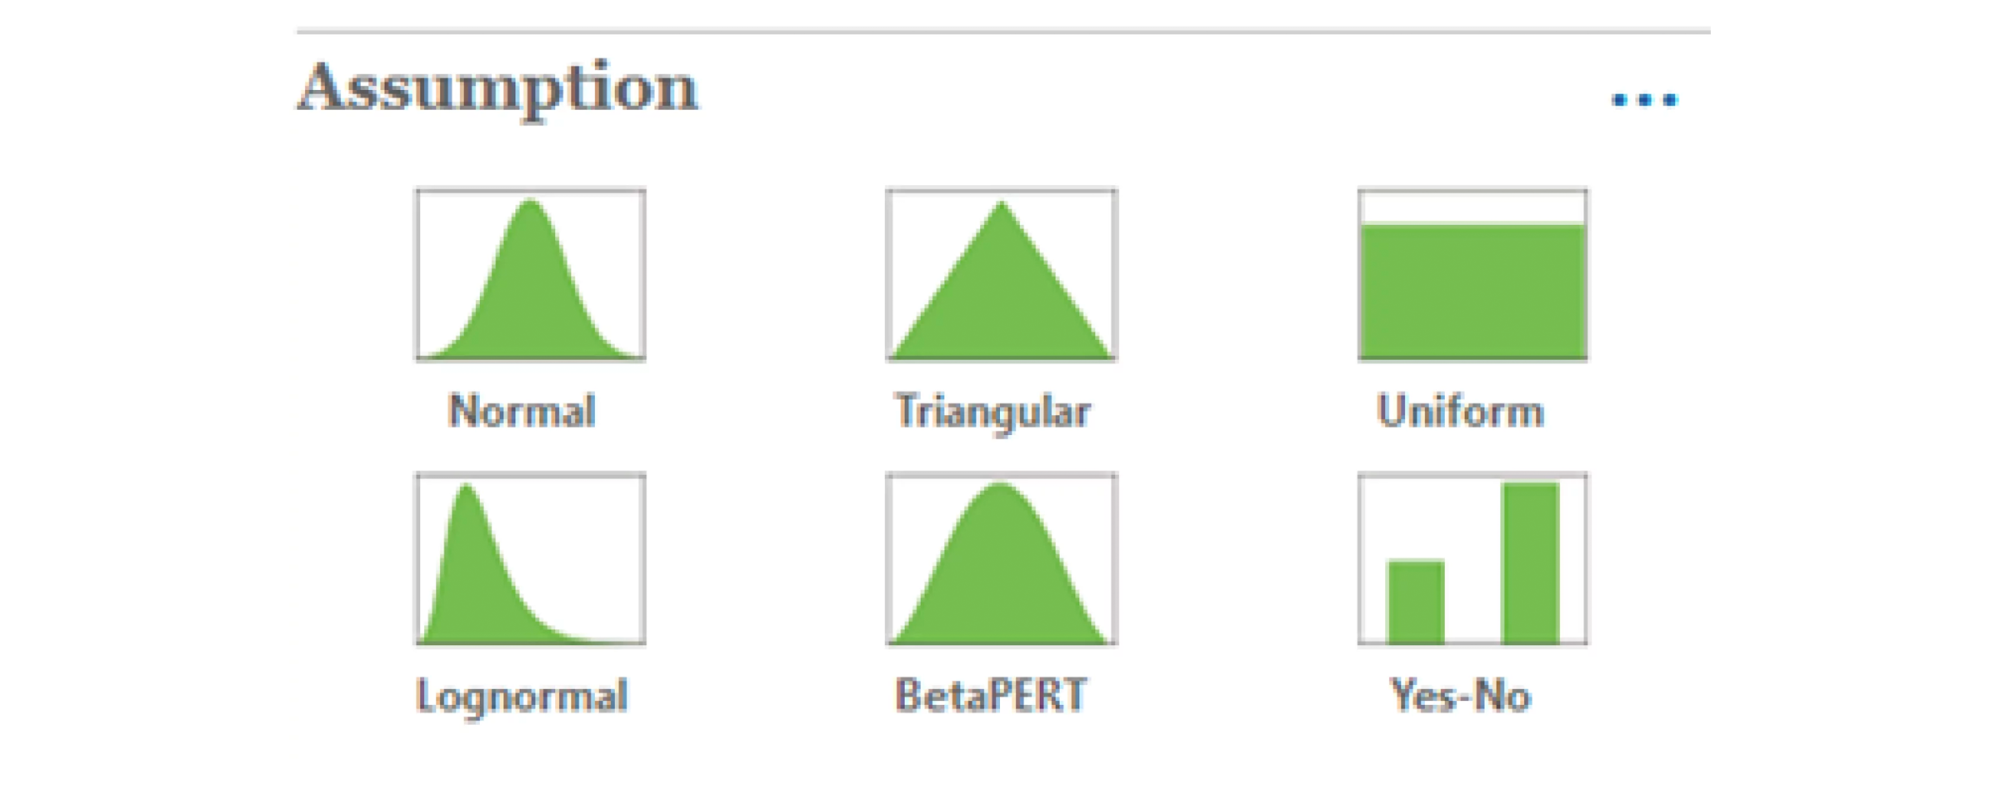
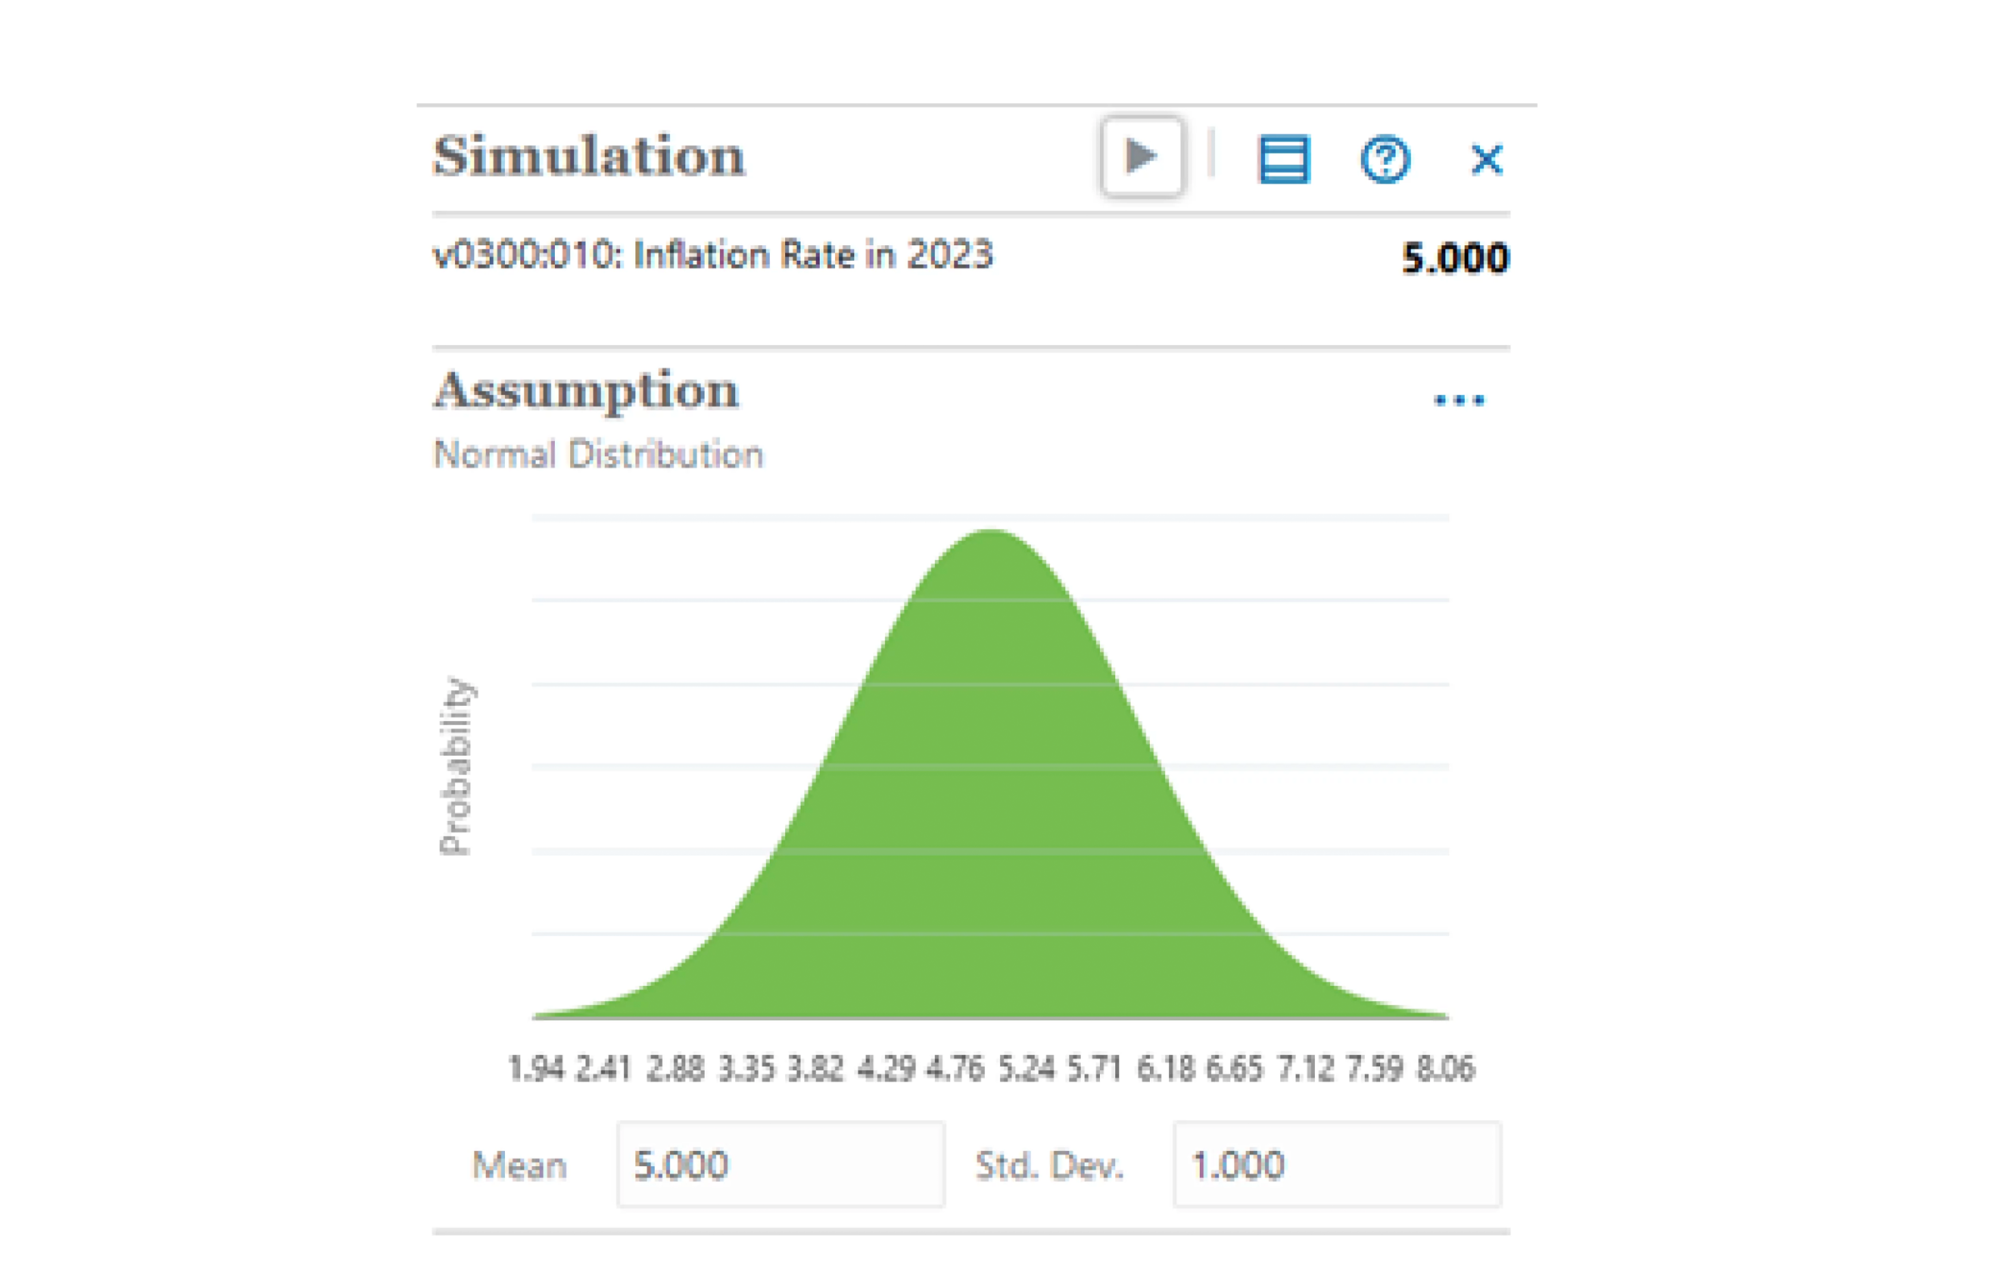
You can pick the distribution curve that best fits the range of potential values for your uncertain input assumption. For example, let’s say you are trying to forecast the inflation rate for next year as that is a key input into your organization’s cost structure. Your best guess is that it will be 5%. You could input that and call it a day. But what if you are wrong? That could cause a big miss in your related expense forecast, which would in turn impact your earnings and EPS forecast. It would be far better to forecast in ranges using your best guess of 5% as the baseline or mean and then forecast a range of possible inputs using a distribution curve. In the example below, we use a normal (“bell-shaped”) distribution curve with 5% as the mean and a standard deviation of 1. If we set up the Monte Carlo simulation to run 1,000 trials or simulations, it will choose values at random that fit the shape of the distribution curve. The majority of the 1,000 simulations will provide inflation values between 3% and 7% but it will also select some values in the tails of the curve so we can see what happens to our key outputs if inflation is 2% or 8%.
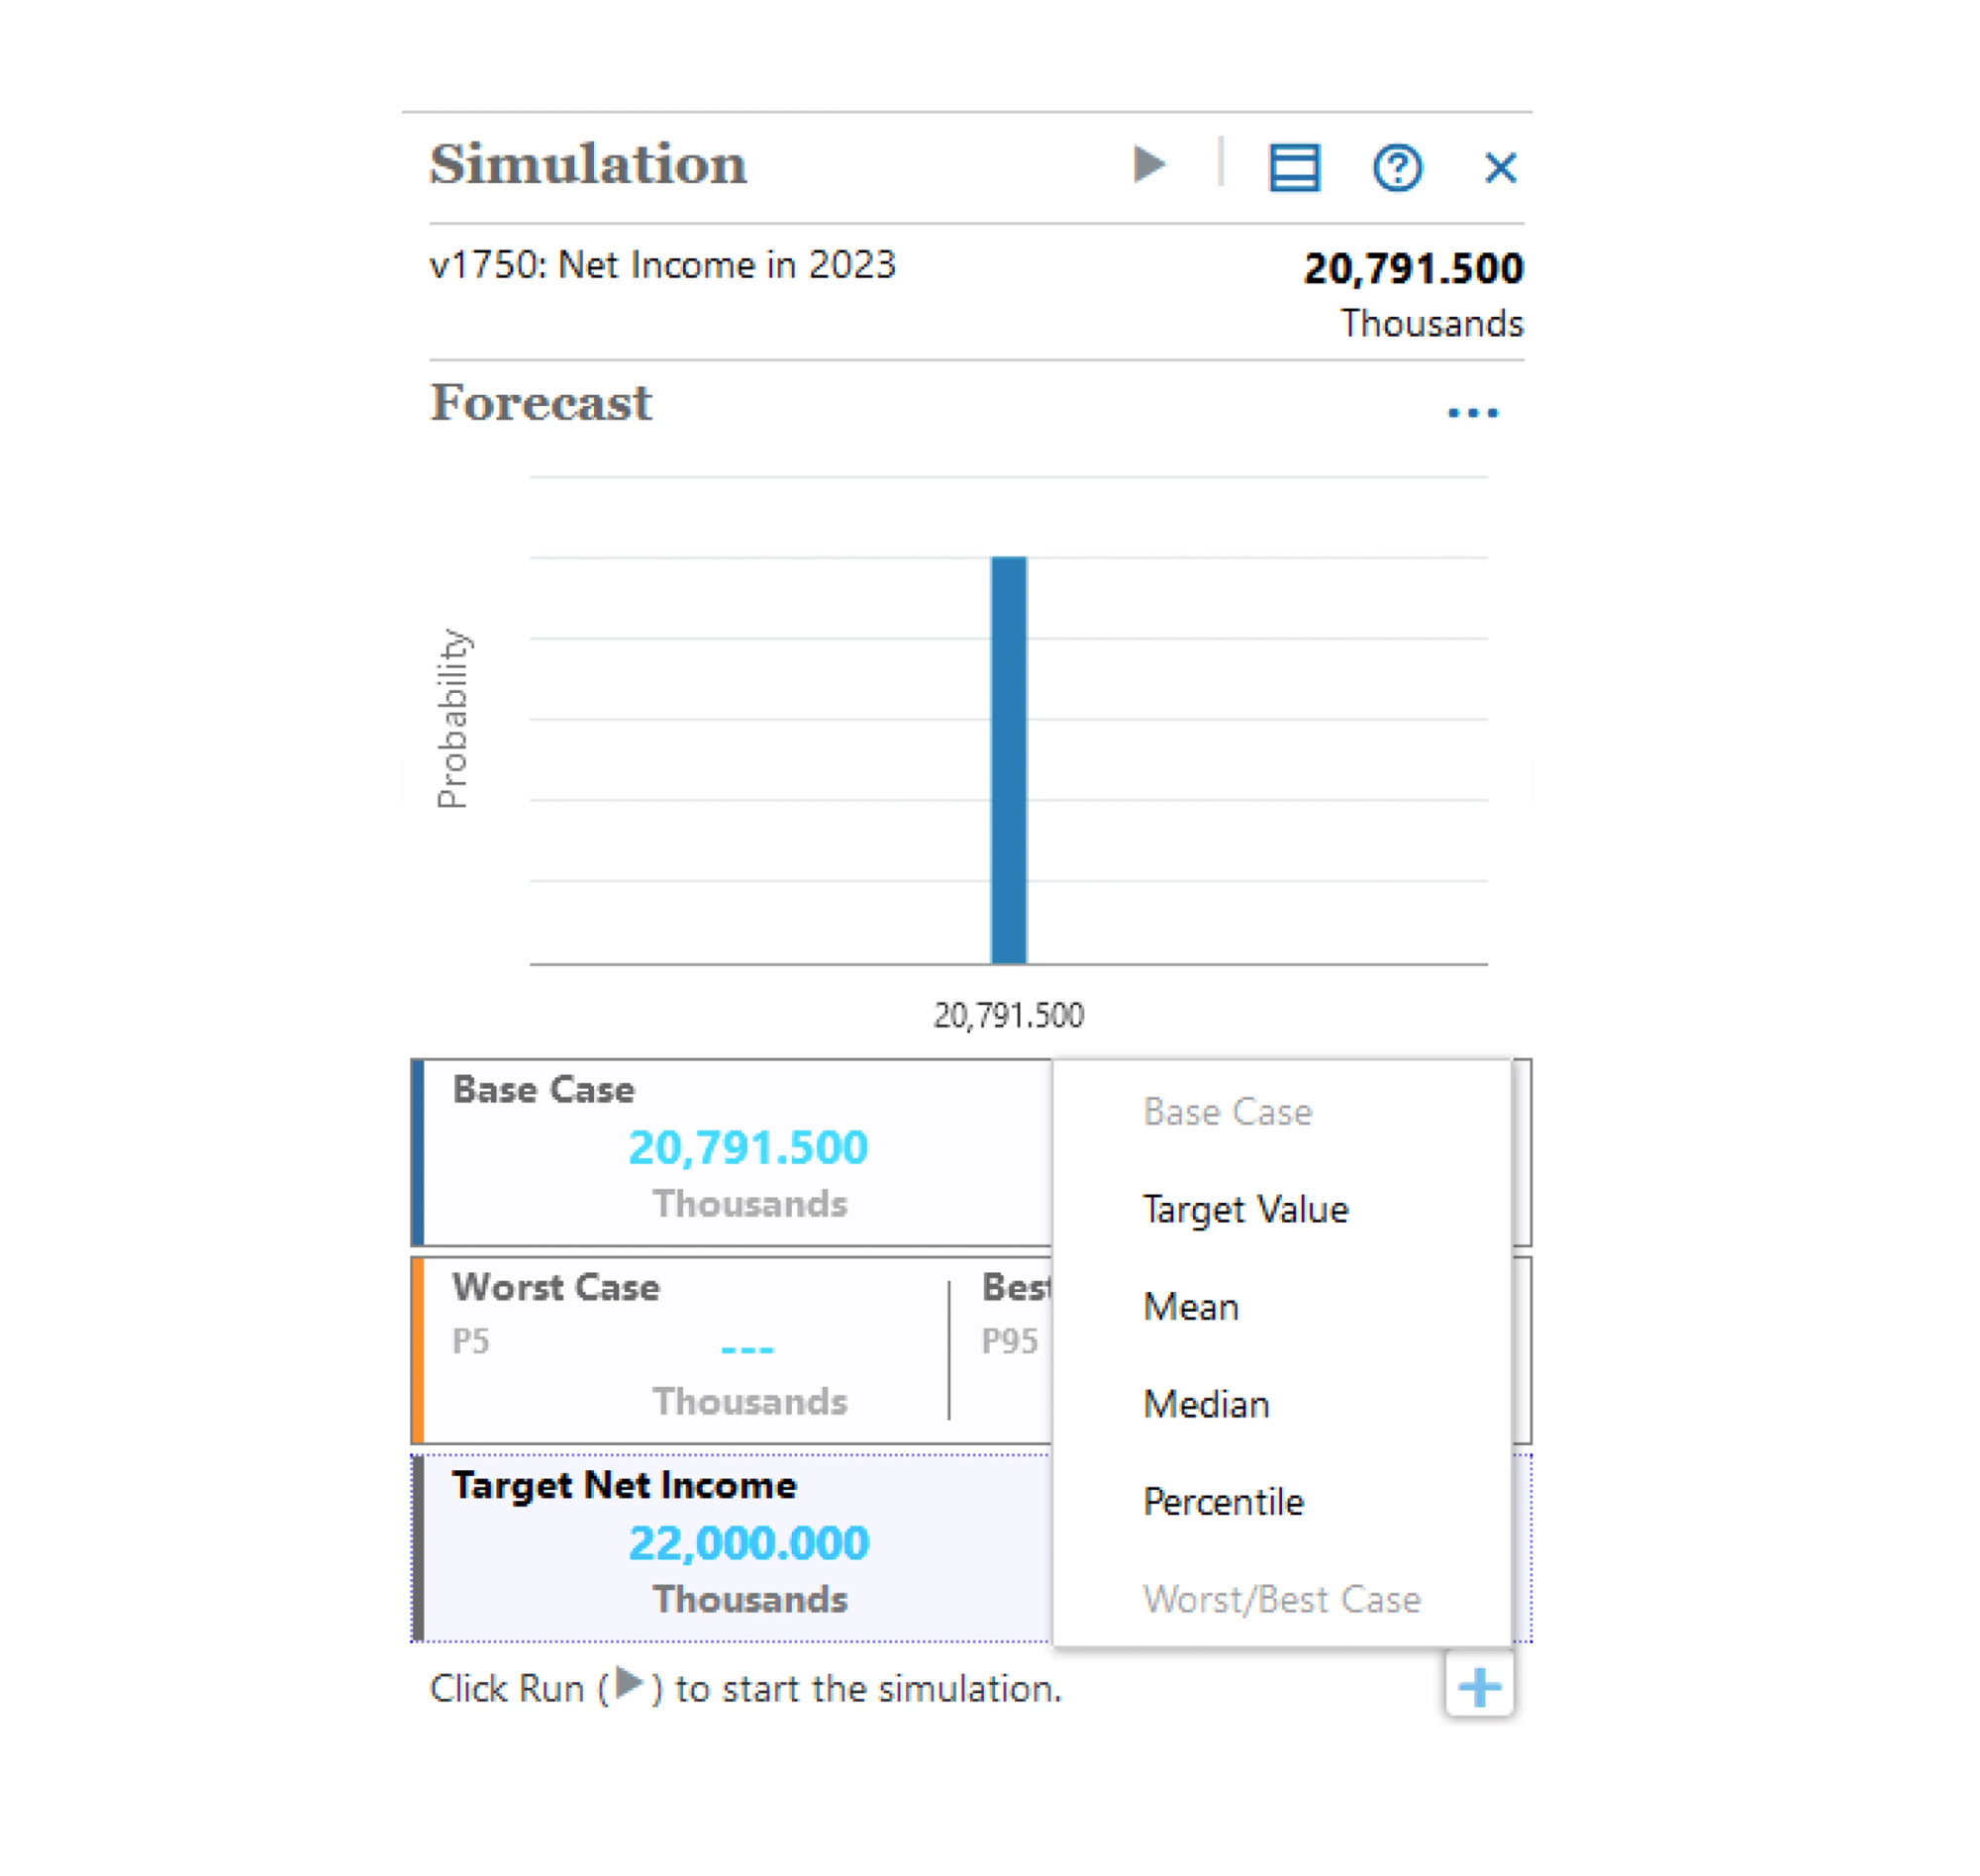
After you have applied distribution curves to the uncertain or risky assumptions in your model, the next step is to define the key outputs or “forecasts” that you care about and how you want to measure them by including percentiles, means, medians, and target values.
Strategic Modeling’s simulation capabilities complete these three steps iteratively for each trial:
- For each cell that you define as an assumption, Strategic Modeling generates a random number based on the range and distribution curve defined and inserts it as an input into the model.
- Strategic Modeling recalculates the model.
- An output value is retrieved from every defined forecast cell and is added to the histogram (chart that shows the frequency of output results from the simulation).
After running 1,000 trials or simulations through the calculation engine of Strategic Modeling using the ranges and distribution curves from the previous steps, we can start to draw statistically significant conclusions regarding our model and its key outputs. In the example below, we can see that there is only a 0.5% certainty of hitting our target net income goal of $22,000. We can also see that our worst-case or 5th percentile is net income of $19,942 and our best-case scenario or 95th percentile is net income of $21,661 and that we have an 80% certainty of achieving net income of $20,348.

How can our organization leverage Monte Carlo simulations to stress test models and improve forecasting accuracy?
Now that we’ve covered the basics of what Monte Carlo simulations are and how they work in conjunction with Strategic Modeling, let’s talk about how they can improve your organization’s risk management and forecasting processes.
If you haven’t already done so, the first step is to implement Oracle’s Strategic Modeling solution. This product is best-in-class and purpose-built for Strategic Planning and Scenario Modeling. During the implementation process, you will want to clearly define your risk and value drivers and have them appropriately drive your financial forecast model.
After your model is designed and built in Strategic Modeling, the next step is to define the uncertain or risky input assumptions in your model and assign distribution curves and ranges of probable values for each.
By forecasting uncertain assumptions using ranges, you will be able to identify black swan events and understand if your organization has the financial strength to withstand such an event. You can stress test adverse economic impacts like exchange rate movements, commodity fluctuations, a recession, and stock market crashes to see how earnings per share, credit ratings, covenants, and liquidity hold up under these circumstances.
Finally, you will generate greater accuracy in your forecasts by providing means, medians, and percentiles that will communicate the statistical probability of certain outcomes and financial results rather than a best guess. By running hundreds or thousands of trials, you can see the full gamut of possible outcomes as well as the likelihood of their occurrence. The end result will be greater forecasting rigor and better decision-making for your organization.
For comments, questions, or suggestions for future topics, please reach out to us at [email protected]. Visit our blog regularly for new posts about Cloud updates and other Oracle Cloud Services such as Planning and Budgeting, Financial Consolidation, Account Reconciliation, and Enterprise Data Management. Follow Alithya on social media for the latest information about EPM, ERP, HCM, and Analytics solutions to meet your business needs.