
Key performance indicators (KPIs) are essential tools for effective project management. However, many companies track them too late, pick the wrong ones or fail to link KPIs to expected deliverables. As a result, critical decisions are delayed, and goals are missed. According to the Pulse of the Profession 2024 report, only 60% of projects meet their initial goals. A major cause is the ineffective use of KPIs.
In our experience, it's not so much that companies aren't using KPIs, but there's often a discrepancy between what the indicators show and what's actually happening on the ground. Phase-based project management can address this gap by syncing KPIs with the project’s true pace. Linking these indicators to key milestones and making them visible to stakeholders transforms KPIs into practical decision-making tools.
In this article, you'll learn how to leverage useful, actionable KPIs during each of the 5 key phases of the project life cycle, from initiation to closure, based on the traditional waterfall model.
This article follows our previous guide to strategic KPIs. This time, we're moving closer to the action, where key decisions are made every day.
How to leverage KPIs during each of the 5 project phases
A project's life cycle typically has 5 main phases: initiation, planning, execution, monitoring & control, and closure. This structure, still widely used in project management, was formalized by the Project Management Institute and remained the standard before the emergence of agile methods. Today, these phases are interpreted and adapted according to the type of organization.
- Initiation: Assess the opportunity, set project objectives and identify required resources.
- Planning: Set the scope, timeline and budget, allocate resources, identify risks and plan communications.
- Execution: Complete project deliverables as planned.
- Monitoring & control: Monitor progress, address gaps and adjust the plan as needed.
- Closure: Close out the project, document lessons learned and release resources.
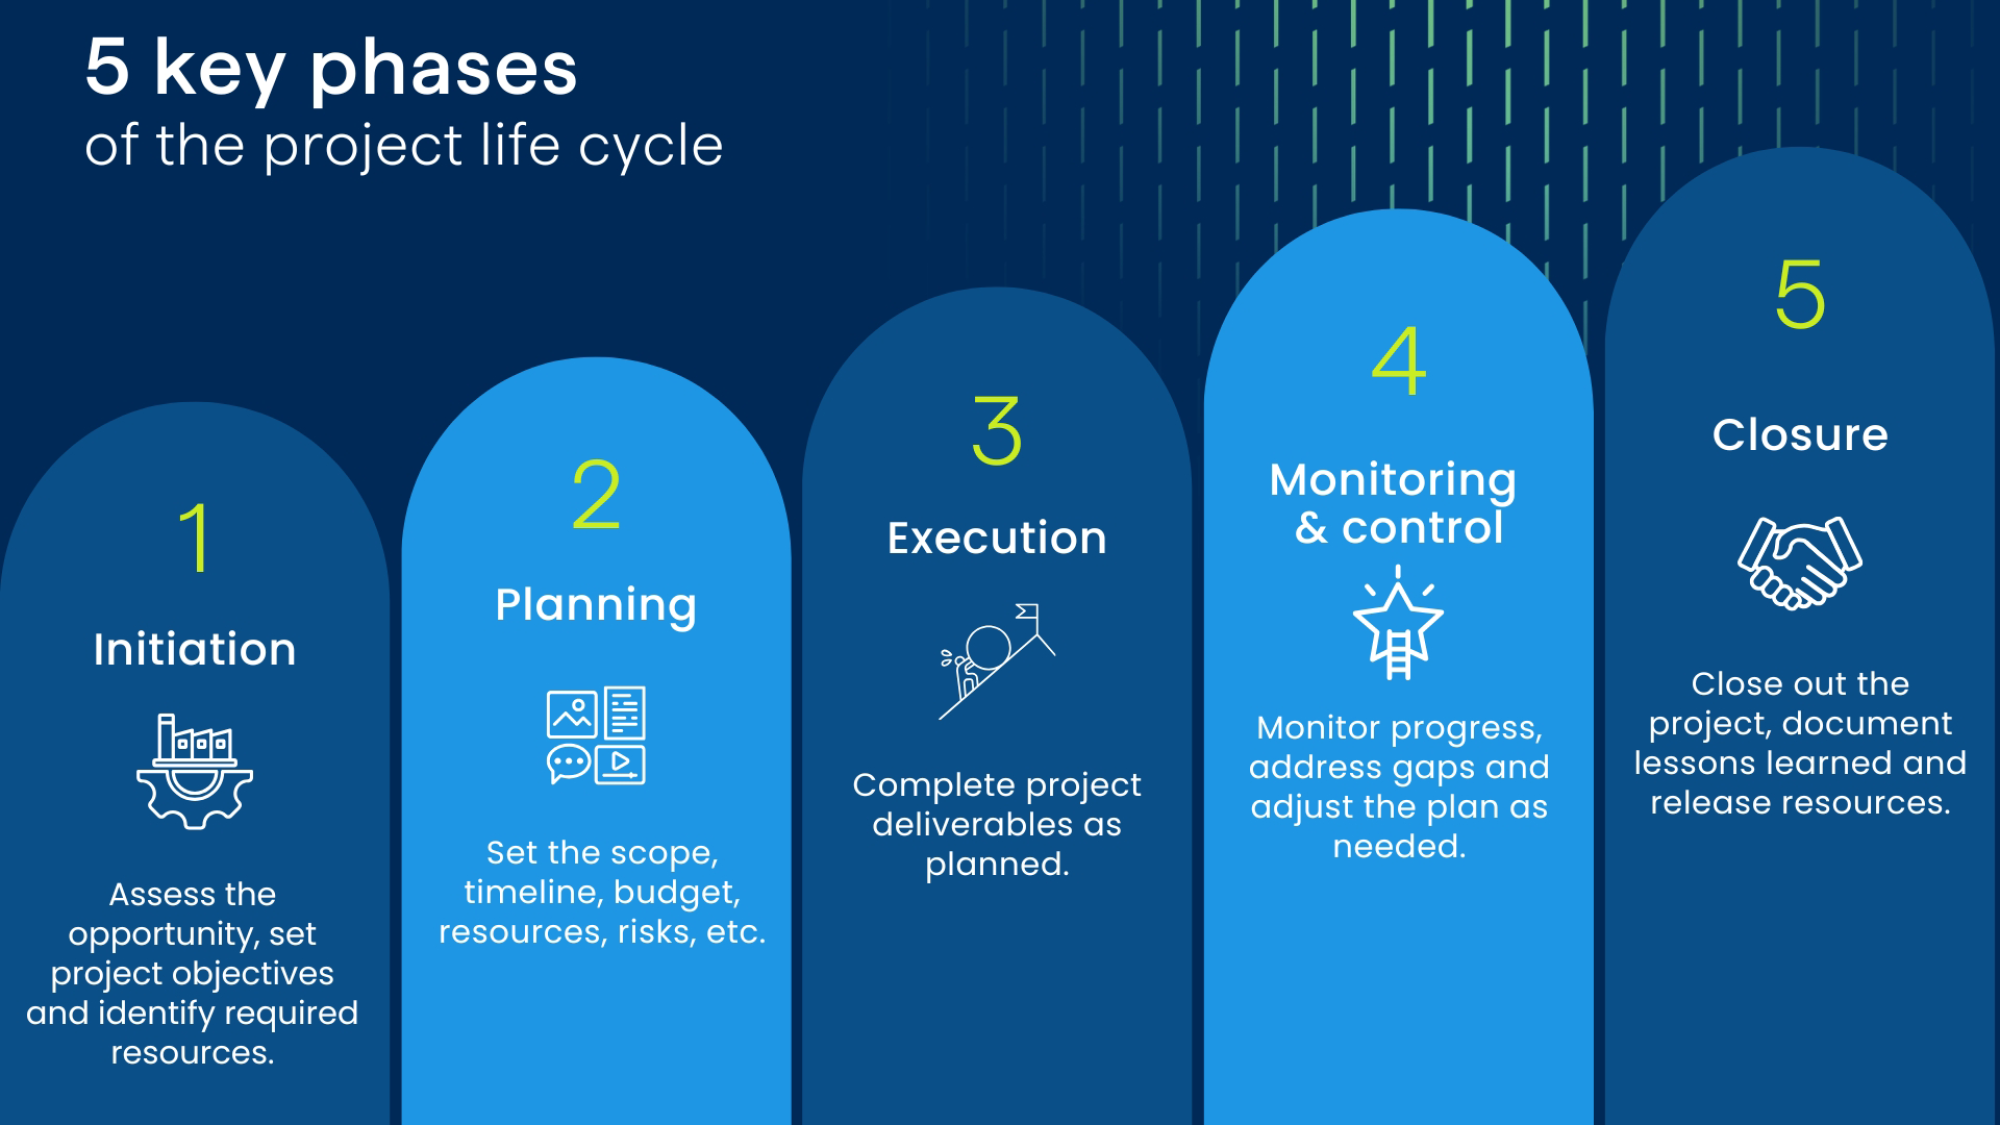
5 key phases of the project life cycle
The phases aren't always linear: they may overlap, repeat or require adjustment depending on the circumstances. The crucial point is that each phase has its own goals and specific outputs, and therefore its own key indicators to monitor.
Phase 1 – Initiation: assess the opportunity using relevant indicators
Success starts with choosing the right project. The initiation phase confirms that the project is worth the effort.
When launching a project, you need to present a clear business case. The team needs to ensure that the project is relevant, feasible and aligned with the company's strategy. During this phase, KPIs are used to identify projects that are worth pursuing.
A common challenge during this phase is justifying a project without any tangible indicators of its expected value. Too often, projects are launched based on intuition or vaguely defined "strategic interest". A good initial KPI acts like a safeguard, reflecting genuine alignment rather than just enthusiasm.
Useful KPIs:
- Initial risk score helps identify project risks upfront and frame the right assumptions.
- Strategic alignment measures how closely the project supports the organization's goals.
- Estimated benefit-cost ratio helps estimate the expected return on investment (ROI) to confirm early on if the project is worth pursuing.
Expected outputs should also reflect the project's initial goals in terms of scope, added value and strategic alignment.
Expected outputs:
- Clear and measurable profitability analysis
- Project charter
- Formal committee endorsement
- Official project setup in the systems
- Kick-off meeting with key stakeholders
Key takeaways on KPIs in the initiation phase
Once launched, the project needs to be structured. Effective planning can turn strategic intent into a realistic, shared action plan.
During this phase, the right KPI doesn't just look good on paper: it's a strategic safeguard that keeps time and resources from being spent on misaligned projects.
Even with the right indicators, it's crucial to set clear guidelines from the start. Understanding the role of KPIs and incorporating them into early decisions maximizes their impact. For example, using a quantified benefit-cost ratio instead of a general impression will strengthen your analysis. Differentiating between strategic indicators and vanity metrics helps you achieve better alignment of projects with business priorities.
Pitfalls to avoid in phase 1:
- launching a project without clear indicators of expected value,
- mistaking political interest for strategic alignment, and
- approving a project without consulting key stakeholders.
Phase 2 – Planning: break down deliverables and anticipate risks
In phase 2, strategic intentions are transformed into a concrete plan with clear responsibilities and a defined timeline.
Useful KPIs:
- Work breakdown structure (WBS) coverage shows if tasks have been properly identified.
- Critical path analysis helps map out sequencing and identify tasks that could directly impact the overall timetable if delayed.
- Gap between estimated workload and actual capacity signals risks of overload.
- Risk assessment estimates the probability, financial impact and potential losses of each identified risk.
Expected outputs:
- Detailed WBS action plan
- Communication plan and clearly identified stakeholders
- Structured log of risks, challenges, decisions and actions
- Timetable confirmed with the project teams
- Project management plan
Even if the execution is solid, poor planning can undermine your success. This phase lays the groundwork for effective project management.
In agile environments, you don't necessarily plan the full project trajectory from the start. Instead, the work proceeds in short cycles, each starting with a planning session. This changes the type of KPIs you need to monitor: they need to be dynamic and evolve with each iteration.
Pitfalls to avoid in phase 2:
- Overly detailed plan that's disconnected from actual capacity
- KPIs focused on activity rather than deliverables
- Lack of qualitative and quantitative indicators for risk monitoring
- Indicators not linked to key project milestones: failing to anchor KPIs in deliverables creates the illusion of oversight with no real impact
Phases 3 and 4 – Execution and monitoring & control: real-time adjustment with current KPIs
This is the heart of the action. The teams are moving forward, risks are unfolding, and decisions need to keep pace. Planning is no longer enough—you need to be able to adjust continuously.
During phases 3 and 4, the teams execute planned tasks while managers keep an eye on alignment. KPIs are essential to catching issues early and making timely adjustments before they escalate.
Useful KPIs:
- Earned value management helps track project progress and anticipate future results.
- Overall project health combines indicators related to timing, quality, scope, budget and risks.
- Deliverable acceptance rate measures perceived quality.
- Active vs. mitigated risks reflects risk control.
Expected outputs:
- Clear project dashboard shared with the project sponsor and team
- RAID log (Risks, Actions, Issues and Decisions)
- Managing project changes
- Managing deviations from the initial plan
- Managing stakeholders and communication
These indicators can be integrated into an accessible, up-to-date project dashboard for all stakeholders. What makes these KPIs relevant isn't their mere presence but the fact that they are current. Outdated data leads to a false sense of control. It's one of the most common pitfalls we see: the right indicators are updated too late or not at all.
A KPI is meant to influence decisions, not just exist on paper. If it's late, it's ineffective.
Pitfalls to avoid in phases 3 and 4:
- Tracking a KPI too late to influence decisions: updating an indicator at the end of a sprint or phase doesn't help course correct in real time
- Project team not made aware of performance indicators
- Too much or non-priority data: beyond 10 indicators, the dashboard becomes cluttered and less useful for project monitoring
- Lacking committees or spaces to discuss KPIs: without regular review, indicators aren't analyzed or used to adjust actions
Phase 5 – Closure: measure impact and document lessons learned
The project is wrapped up—or so it seems. Without proper project closure, you miss out on two key opportunities: learning as a team and confirming if the project delivered the expected value. It's during this phase that you gauge the project's true impact and extract insights for future projects.
Learning takes place throughout the project and should be documented along the way. This phase is about putting it all together so lessons can be shared and leveraged in future projects.
Useful KPIs:
- User satisfaction, often measured through surveys or net promoter score (NPS).
- % deliverables accepted as-is reflects final quality.
- Number of documented lessons learned reflects learning capacity.
- Difference between final cost and approved initial cost measures the accuracy of estimates, particularly for project-driven, sales-oriented organizations.
Expected outputs:
- Structured debrief with recommendations, documented in a centralized knowledge hub
- Signed project closure form
- Resource evaluation (360-degree where applicable)
Proper project closure leaves your organization stronger. Too often, this phase is overlooked, limiting the ability to apply the lessons learned.
Pitfalls to avoid in phase 5:
- Forgetting the impact assessment or replacing it with superficial paperwork
- Failing to document or share project feedback
- Collecting customer satisfaction data too late or failing to leverage it
Key takeaway: timeliness, not quantity counts when it comes to KPIs
KPIs are navigational aids, not an end in themselves. Knowing when, where and why to use them is key. Applied at the right time for each project phase's expected outputs, they clear up confusion, sharpen focus and support sound decisions. The right KPIs help build project momentum rather than hold it back.
From experience, we know it's not the quantity of indicators that matters, but the quality of the indicators—carefully chosen, continuously updated and leveraged at the right time. That's the difference between a simple dashboard and a genuine navigational tool.
Want to better align your indicators with project milestones?
We help PMOs and managers integrate the right KPIs with tools like Microsoft Project, Jira, Power BI and more. By leveraging indicators at the right time, you gain visibility without making monitoring more complex. Let's discuss your current tools and how you can optimize them phase by phase. Contact our experts today.